Can I reproduce the released values?
I recalculated mass ratio, symmetric mass ratio, chirp mass, source-frame chirp mass, and effective spin from the released samples. The checks keep mass frames and spin epochs separate.
Reproducible gravitational-wave data audit
I built a bounded reproduction and robustness audit of the public parameter-estimation samples for GW241011_233834 and GW241110_124123.
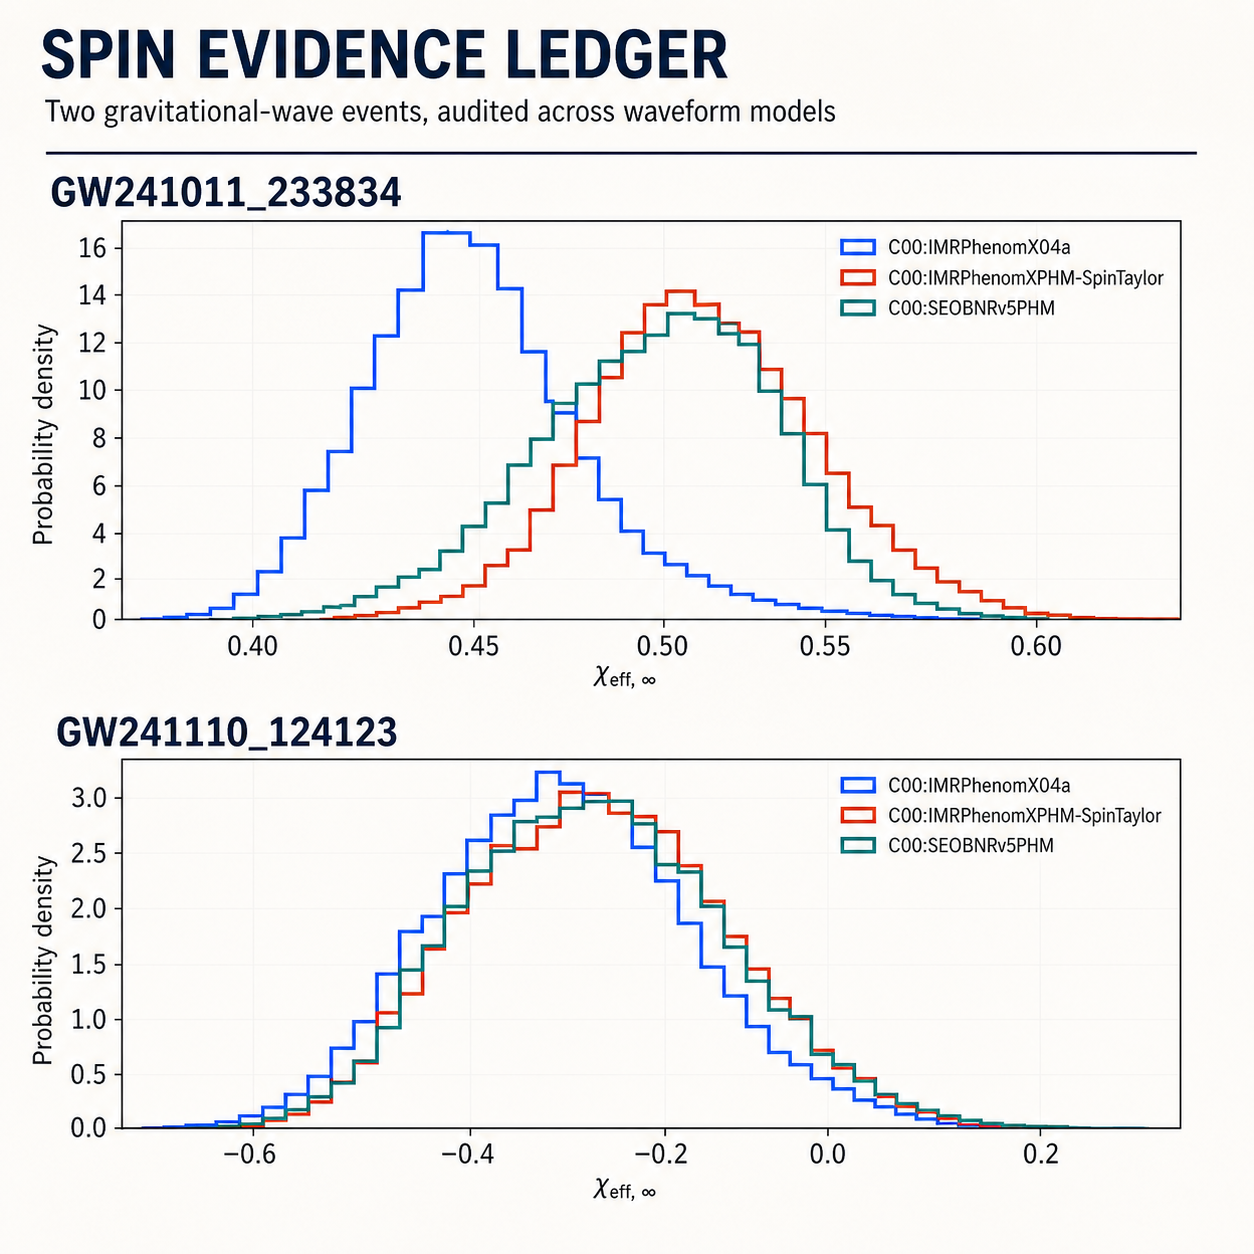 Open the full comparison figure ↗
The question
I recalculated mass ratio, symmetric mass ratio, chirp mass, source-frame chirp mass, and effective spin from the released samples. The checks keep mass frames and spin epochs separate.
I compared the one-dimensional posterior distributions from three waveform analyses. A posterior is the probability distribution for a parameter after the observed signal is included.
That calculation requires each posterior’s matching sampled prior, which represents the assumptions in place before the signal was considered. Those samples were not present in the release.
The process
The workflow checks the published archive size and MD5, records a local SHA-256, rejects unsafe archive members, and extracts only the standard parameter-estimation material.
I preserved the exact analysis labels, parameter names, weights, sample counts, effective sample sizes, and missing fields before running numerical work.
Derived quantities were rebuilt sample by sample and checked against preset tolerances. Rounded summaries were also compared with the paper and GWOSC values.
Pairwise Jensen-Shannon divergence used shared histogram support, 20, 40, and 80-bin sensitivity checks, 500 seeded bootstrap replicates, and same-model split-sample checks.
Verified results
The horizontal axis is χeff,∞, a mass-weighted measure of the net spin component along or against the orbital direction when the system is evolved back to very large separation. The vertical axis is probability density, not evidence for one model.
Largest audited marginal divergence, for IMRPhenomXO4a versus IMRPhenomXPHM. The blue posterior is shifted from the red and teal results.
90% bootstrap interval: 0.581258 to 0.595403 bitsCorresponding descriptive maximum for the second event. The three posterior curves overlap much more closely.
90% bootstrap interval: 0.015594 to 0.019612 bitsThese are one-dimensional posterior-analysis divergences, not significance scores. Missing prior comparisons mean the separation cannot be assigned to waveform physics alone.
Reproduction ledger
No comparison contained a sample outside its preset tolerance. The largest sample-level absolute algebraic difference was 8.882 × 10⁻¹⁵.
The seven differences all involve the paper’s specialized HPD-in-cosine spin-tilt bounds. Ordinary central-interval quantities agree at their printed precision.
Why KL divergence is not reported
The six analysis groups do not include prior samples, and their configuration files do not fully define the priors in a machine-readable form. Because KL divergence compares a posterior with its prior, it cannot be reproduced from the available files.
These missing inputs only affect the prior-to-posterior information-gain and prior-to-prior comparisons. The 48 derived checks and 42 posterior comparisons above use the released posterior samples and remain complete.
Inspect the work
Generative AI assisted with repository scaffolding, implementation drafts, tests, and documentation. It was not used to estimate any scientific number. Read the full disclosure ↗
Project boundary
The project does not validate either discovery, classify either event, infer a population or formation channel, test a hierarchical-merger or eccentricity hypothesis, or replace review of the full multidimensional posterior.
Return to the portfolio